
People & Culture
The biggest year in Canadian birds
A tale of joy and persistence: Logging Bruce Di Labio’s birding “big years” almost 50 years apart
- 4123 words
- 17 minutes
Wildlife
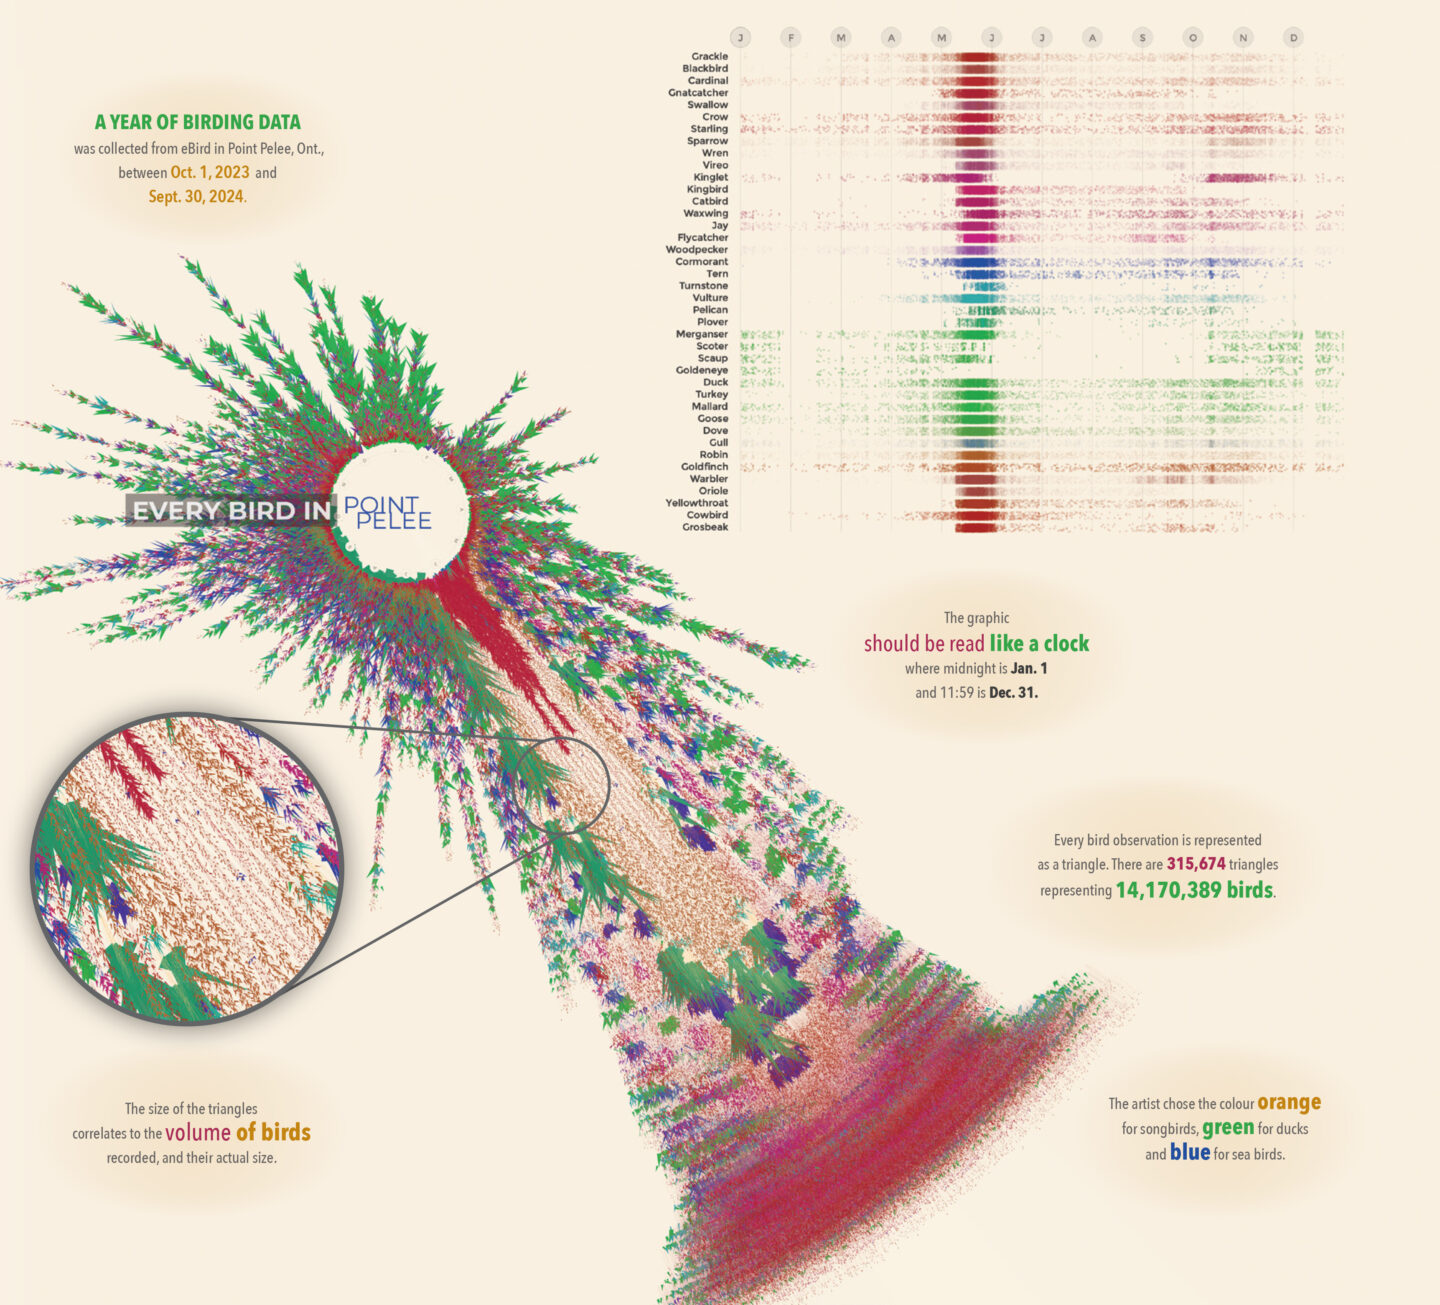
Artist Jer Thorp creates a visual checklist of every bird counted in one year on the southernmost point of mainland Canada
Jer Thorp’s “Every Bird” poster series is proof that big data can be beautiful. One of the world’s foremost data artists, the Canadian educator is renowned for turning complex datasets into eye-catching artworks. He also happens to be a keen birder. “It’s fair to say I’m a little obsessed,” Thorp writes in a blog post introducing the series. “Obsessed in particular with how it isn’t just birds that are represented in bird data, but a kind of conversation — between a bird, a person and a place.”
These data visualizations are exuberant and dazzling, the reds, oranges, blues and greens swooping across the page in a brilliant representation of a year in the bird life of a particular place. In the case of Point Pelee, Ont., Thorp’s graphic shows an explosive blast of red, pink and green in the area corresponding to May and June. Though the different hues represent different birds — from cormorants to catbirds, geese to gulls — here they merge in a teeming streak that portrays a hectic spring migration across the Lake Erie super flyway.
That concentrated colour blast is a reminder, Thorp says, of how lucky Canadians are to experience the migration.“Most of us who live in the Canadian population belt along the border see this twice a year and think of it as a normal thing,” he says. “We forget, because we grew up with it, how amazing it is to have this most spectacular natural thing happen.” The Point Pelee poster is a vivid prompt to slow down and look skyward.
Thorp creates his artwork using data collected when birders submit their checklists to eBird, the world’s most popular citizen science platform. Scientists use this data to estimate populations, better understand migrations, map species ranges and abundance — the list goes on.
But Thorp is intent on telling a different kind of story, combining data and creativity to encourage us to spend some time with the birds. Close up, the detail shines — on the Point Pelee poster, an eruption of the tiniest orange triangles, looking for all the world like a puff of dust, is the warblers passing through, while the strident turquoise triangles point to vast flocks of geese. “I think sometimes we’re expected to digest data visualization really quickly,” Thorp explains. “You open a news story, and there’s a data visualization, and you’re meant to learn it and then move on. That’s not what I wanted with these. I want people to put them up in their house and keep discovering new things over weeks and months.”
This story is from the May/June 2026 Issue
People & Culture
A tale of joy and persistence: Logging Bruce Di Labio’s birding “big years” almost 50 years apart

Wildlife
Award-winning birder and acclaimed writer Pete Dunne explores how birds in North America have adapted to survive the challenges of the winter season
Mapping
These federally protected areas are located along avian superhighways — also known as flyways — traversed by millions of birds on their annual migrations. They provide vital stopover sites and breeding grounds.
Environment
La Forêt Carolinienne accueille une biodiversité exceptionelle au cœur de la région la plus urbanisée du Canada. Aujourd’hui, quelques personnes dévouées se battent pour protéger ce qu’il en rests.