Environment
Clean commute
Canada's largest cities are paving the way for more eco-conscious commuting choices
- 3352 words
- 14 minutes
This article is over 5 years old and may contain outdated information.
Mapping

Any urban Canadian will tell you their city’s traffic problem is the hands-down worst, but a new map from The 10 and 3 will settle the debate once and for all.
Data experts Zack Gallinger and Arik Motskin studied how long it would take to travel a variety of routes in major Canadian cities during free-flowing traffic and during a worst-case scenario* traffic jam. They called the ratio between these two trip times the “traffic stretch multiplier.”
For example, if it would take you 20 minutes to get from point A to point B in free-flowing traffic but your city has an average traffic stretch multiplier of 1.8, the same trip would take you 36 minutes in worst-case traffic.
So which cities have the highest traffic stretch multipliers? Unsurprisingly, Toronto tops the list with an average traffic stretch multiplier of 2.8. The problem, the study’s authors say, is the city’s highways are ill-equipped to deal with the population density of the surrounding communities.
“While a trip downtown from dense residential areas like Markham in the north or Scarborough in the northeast could take under a half hour in free-flow traffic, commuters in peak traffic can expect a voyage of well over 75 minutes,” they write.
Rounding out the top three are Montreal and Vancouver with traffic stretch multipliers of 2.3 and 2.0 respectively. There, as in Toronto, infrastructure is having trouble keeping pace with demand.
Most of the rest of Canada faces much less severe traffic stretch than the country’s three largest cities, but growing cities like Calgary and Ottawa are beginning to feel traffic pressure: certain routes within those cities can produce traffic stretch multipliers of 2 or more during worst-case scenarios.
*For each route studied, the authors used the route prediction tool on Google Maps to find the free-flow time and the worst-case time along that route.

Canadian cities ranked by traffic stretch. (Map: The 10 and 3)
Are you passionate about Canadian geography?
You can support Canadian Geographic in 3 ways:

Environment
Canada's largest cities are paving the way for more eco-conscious commuting choices

History
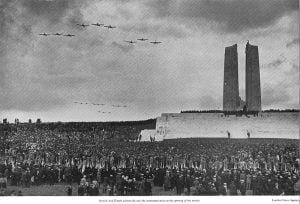
A trip back in time to the memorial’s dedication

Mapping
If you’ve ever had to help make a map, it gives you a whole new appreciation for the art form. As editor of Canadian Geographic, I’ve found myself more…

Exploration
The significant CSA events since Alouette’s launch