Science & Tech

Is it “normal,” or is it climate change? Understanding Canada’s weather extremes

Known as the Rapid Extreme Weather Event Attribution system, a new program from Environment and Climate Change Canada measures how global warming affects our local weather

  • Jun 18, 2026
  • 1,449 words
  • 6 minutes
[ Disponible en français ]
Extreme weather has become an increasingly familiar phenomenon around the globe in recent years, and Canada is no exception. Environment and Climate Change Canada's new Rapid Extreme Weather Event Attribution system measures how global warming affects our local weather. (Photo: Karen Hase/Can Geo Photo Club)
Expand Image
Advertisement
Advertisement
Advertisement

The scariest part of Halloween in 2025, for much of Eastern Canada, was the weather. Hurricane Melissa had spent the previous week lashing the Caribbean with record-tying sustained winds of over 300 kilometres per hour and gusts of over 400 kilometres per hour, killing at least 95 people in Jamaica, Haiti and elsewhere. Though its force had weakened by the time it reached Canada, torrential downpours drenched Quebec and the Atlantic provinces.

Extreme weather has become an increasingly familiar phenomenon around the globe in recent years, and Canada is no exception: atmospheric rivers in British Columbia, unusually cold spells in Saskatchewan (which is saying a lot!), heat waves in Quebec, and so on, sometimes with secondary effects like flooding and out-of-control wildfires. Whenever extreme events like Hurricane Melissa occur, there’s a question lurking behind the headlines: is this climate change? Is the severity of this particular weather system somehow related to the gradual warming of the planet?

Such questions have always been challenging to answer, because weather is proverbially unpredictable. But Environment and Climate Change Canada has figured out a way to measure how climate change affects our local weather. When conditions are unusual or unseasonal compared to historical norms, the Rapid Extreme Weather Event Attribution system now kicks in within 24 hours for precipitation events and within a week for temperature events to estimate how much more or less likely the current observations are in today’s climate compared with pre-industrial conditions in the 1800s.

For example, the post-Melissa rainfall of up to 39 millimetres in certain regions of Quebec is the type of weather that is between one and two times more likely now due to the effects of climate change. In Eastern Labrador the next day, the deluge hit levels that were even rarer in pre-industrial times but are now two to 10 times more likely to occur.

Why do we need “event attribution”?

The event attribution system went online in the spring of 2024, initially focusing on heatwaves and later adding cold snaps and heavy precipitation. The idea is borrowed from epidemiology, according to Megan Kirchmeier-Young, a climate research scientist with Environment and Climate Change Canada. Not all smokers get lung cancer, and not all lung cancers are caused by smoking, but epidemiologists are nonetheless able to assign a “fraction of attributable risk” that quantifies how much of a role smoking typically plays in lung cancer.

Extreme weather is similarly probabilistic: not all extreme events are caused by climate change, and climate change doesn’t always cause extreme events. But scientists can use the same kind of methodology to estimate how much more or less likely climate change has made a given extreme event. The system’s basic conclusions aren’t exactly surprising: of 49 heat events analyzed in the summers of 2024 and 2025, every single one of them was made at least somewhat more likely because of human-driven climate change.

Canada is warming roughly twice as fast as the global average, and Canada’s Arctic is warming nearly four times as fast, partly because of the loss of snow and sea ice that used to reflect solar radiation. But moving from the general (“the world is getting warmer”) to the specific and local (“what happened yesterday right here in my town is now five times more likely than it used to be”) helps put these changes in context. “Climate change is already impacting us across Canada,” Kirchmeier-Young says, “and I think it can be hard to understand what that means.”

Putting numbers to the events can also help us figure out how to adapt to our new climate reality. Was that storm a once-in-a-century fluke, or is it now a once-in-a-decade risk? If it’s the latter, Kirchmeier-Young says, “then we can think about how we need to prepare — because that event is more likely now, and as we continue warming it’s going to continue getting more likely.” Over time, the attribution system will build up a library of analyzed events that will paint a more detailed picture of what types of extreme weather events are now occurring in Canada and which ones are getting more or less frequent.

Putting numbers to the events can also help us figure out how to adapt to our new climate reality. Was that storm a once-in-a-century fluke, or is it now a once-in-a-decade risk?

Where do the predictions come from?

The event attribution system uses climate models based on data from the pre-industrial era between 1850 and 1900 to estimate how likely a given temperature was to occur during that era. That produces a bell-shaped probability distribution: extremely cold and hot days at the far ends of the distribution were rare compared with more moderate temperatures.

Models of the current climate produce a similar probability distribution, but shifted to the right because the average temperature is higher. The result is two overlapping curves:

Advertisement
The probability distribution of expected temperatures in the present is shifted to the right, towards warmer temperatures, compared with the distribution from pre-industrial times. As a result, extreme heat events are now much more likely and extreme cold events are much less likely. (Graph: Environment and Climate Change Canada)
Expand Image

It’s clear that extreme heat events are now more likely than they used to be, and the difference between the two curves quantifies that difference. If the event is more than 10 times more likely, the event attribution system will report it as “far more likely”; if it’s between at least two and 10 times more likely, it’s “much more likely”; between one and two times more likely is simply “more likely.”

Here, for example, is the data from a weeklong heat wave in August 2025 in Atlantic Canada. The heat wave broke records, including an all-time high of 39.5 C in Prince Edward Island, and the average temperature across the entire region reached a high of 28.4 C, nearly 10 degrees hotter than the typical daily high.

A temperature like this would have been so unlikely in preindustrial times that this heat wave was rated “far more likely,” meaning it was more than 10 times more likely due to human-caused climate change influences.


The peak temperature of the August 2025 heatwave in Atlantic Canada was four degrees higher than the usual highest temperature of the year in that region, a rare event that is more than 10 times more likely to occur due to the effects of human-driven global warming. (Graph: Environment and Climate Change Canada)
Expand Image

What about extreme cold and precipitation?

Based on the probability curves, extreme cold events should become less likely, while extreme heat events become more likely. That’s pretty much what the event attribution system finds. A cold snap in Saskatchewan in February 2025, for example, which reached a low of -34.5 C, was more than 10 times less likely to occur than in the past.

A snowy scene in Montreal. None of the cold snaps in the Ontario or Quebec regions in the winter of 2025-2026 even met the threshold to be considered “extreme” compared with typical weather of the past three decades. (Photo: Shawn Dearn/Unsplash)
Expand Image

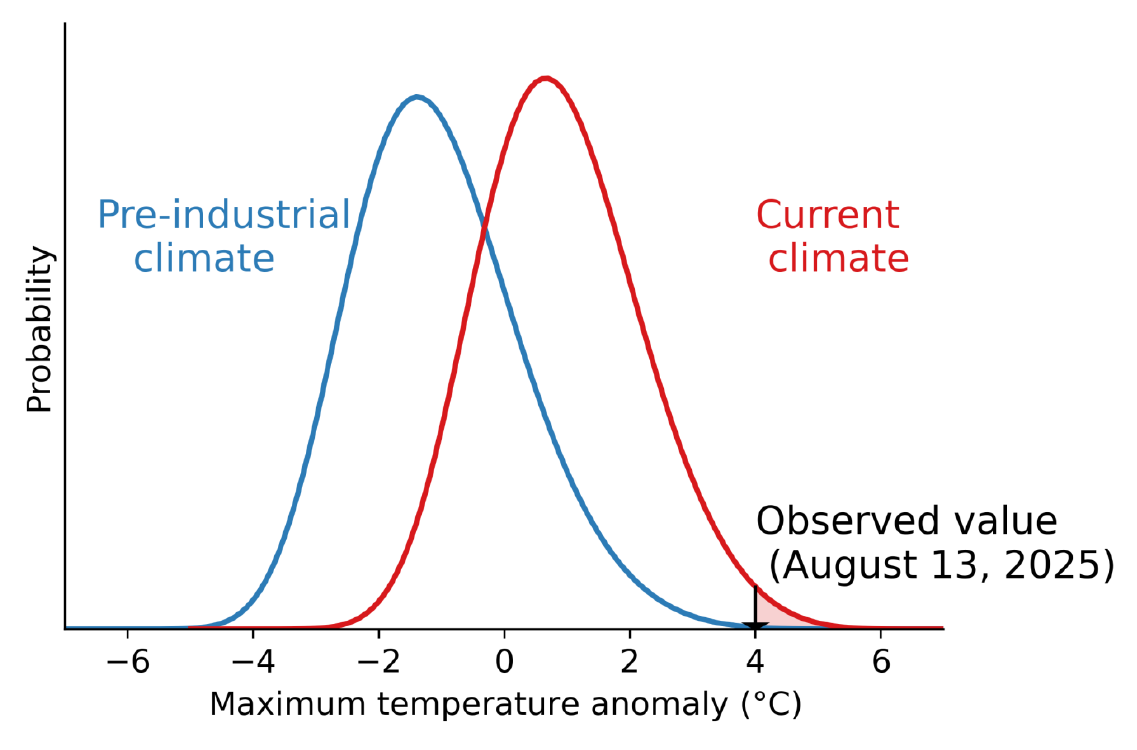
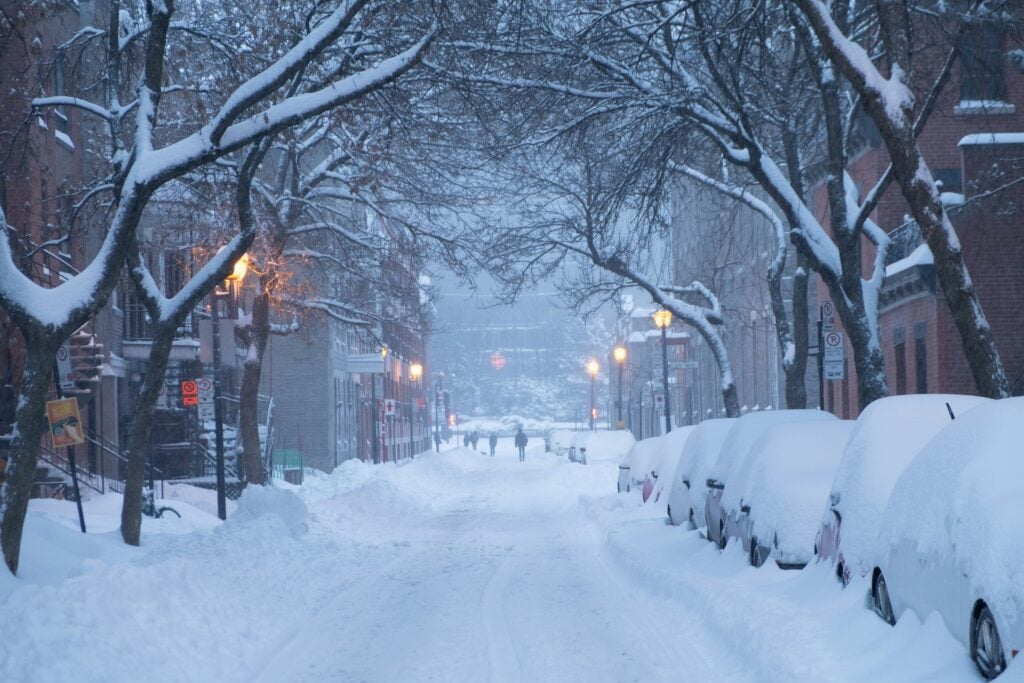
Still, the results aren’t always what you expect. “This winter felt like the cold [wouldn’t] end,” says Kirchmeier-Young, who lives in Toronto. “It’s felt like we’ve had a lot of extreme cold events.” But the event attribution system begs to differ: none of the cold snaps in the Ontario or Quebec regions in the winter of 2025-2026 even met the threshold to be considered “extreme” compared with typical weather of the past three decades. Our memories of the weather we’ve experienced in the past are fallible — which is another reason it’s so helpful to put objective numbers to how unusual extreme weather events are.

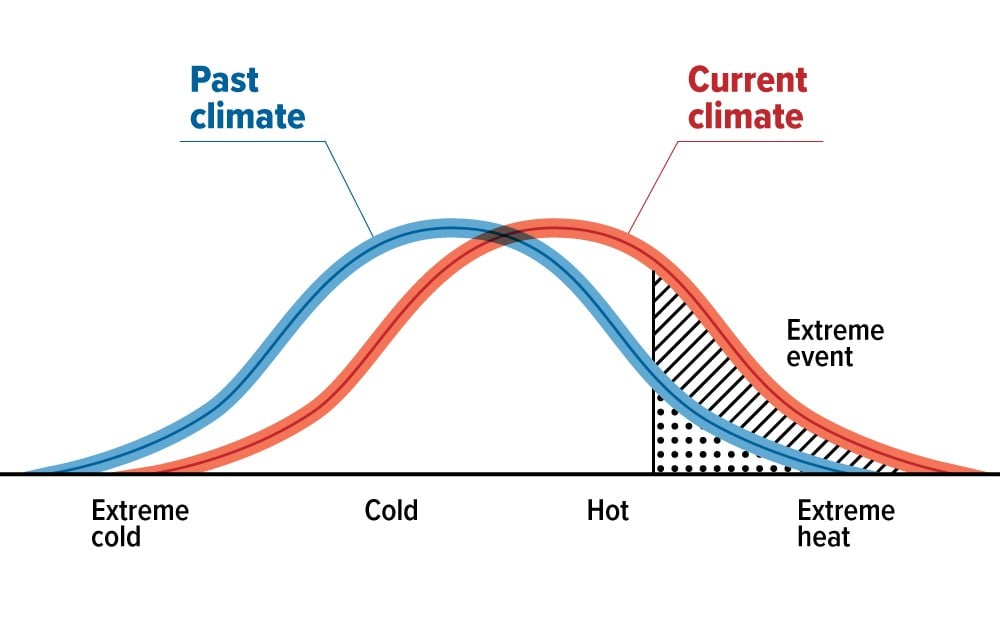
More generally, the relationship between climate change and weather extremes isn’t always as obvious as the simple model suggests. Some scientists believe warming in the Arctic might weaken the air currents that usually keep cold confined to the polar region, causing more cold snaps in southern parts of Canada despite the general warming trend. But the data collected so far by the extreme event attribution system suggests that the dominant trend, by far, is fewer cold extremes.

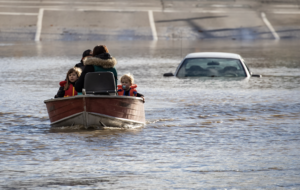
The link between a warming climate and more extreme precipitation is also clear. The main reason, says Kirchmeier-Young, is that warmer air can hold more moisture. That’s why hot summer days are often muggy, while cold winter days are dry. And it means that, in a warming climate, there tends to be more moisture held in the clouds when it starts to rain — and that, in turn, means the biggest rainfalls are getting bigger, with disruptive and sometimes catastrophic consequences.

Those consequences are the next frontier for the extreme event attribution system. Kirchmeier-Young and her colleagues hope to add more complex outcomes eventually, such as droughts, flooding, high humidity, extreme wind and fire hazard — the types of events increasingly dominating headlines and spurring debate about how to respond and adapt to climate change. Already, the system offers a combination of wake-up call and reality check — a way of instantly looking up whether yesterday’s weather was as crazy as it seemed, and whether it’s likely to happen again. Based on the early results, the answers are probably yes and yes.

This story was created in partnership with Environment and Climate Change Canada.

Advertisement

Help us tell Canada’s story

You can support Canadian Geographic in 3 ways:

Related Content

Science & Tech

Est-ce « normal » ou s’agit-il de changements climatiques? Comprendre les conditions météorologiques extrêmes du Canada

Baptisé « Système d’attribution rapide des phénomènes météorologiques extrêmes », un nouveau programme d’Environnement et Changement climatique Canada évalue l’impact du réchauffement de la planète sur notre climat local.

  • 1697 words
  • 7 minutes
leather sea stars

Environment

“We did this:” Is there a way out of our intertwined climate and biodiversity crises?

As the impacts of global warming become increasingly evident, the connections to biodiversity loss are hard to ignore. Can this fall’s two key international climate conferences point us to a nature-positive future?

  • 5595 words
  • 23 minutes

Environment

Canada has a new weather alerting system. Here’s what the colours mean — and what to do when severe weather strikes

Environment and Climate Change Canada has launched a new colour-coded system for its severe weather alerts. Here’s what you should know.

  • 2512 words
  • 11 minutes
George Kourounis inside the Marum crater of Ambrym volcano, Vanuatu

Exploration

George Kourounis: Going to extremes

Whether outrunning a tornado, dodging lava bombs or hunkering down in a hurricane, explorer George Kourounis is most comfortable living on the edge

  • 1058 words
  • 5 minutes
Advertisement
Advertisement