History
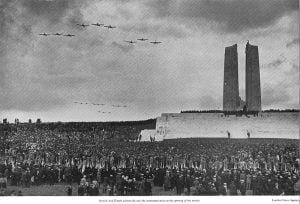
Vimy Canadian Memorial photo essay
A trip back in time to the memorial’s dedication
- 485 words
- 2 minutes
This article is over 5 years old and may contain outdated information.
Mapping

If you’ve ever had to help make a map, it gives you a whole new appreciation for the art form. As editor of Canadian Geographic, I’ve found myself more involved in making maps than I ever expected, particularly as the publication is likely the only one in Canada with a full-time cartographer on board. Cartographer Chris Brackley, along with a little help from our editors and designers, creates a range of maps, from simple and straightforward to comprehensive and creative.
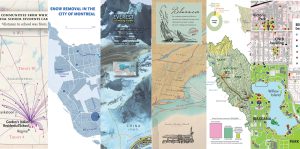
In honour of Geography Awareness Week, I’ve pulled together a list of my favourite maps published in 2015 issues of Canadian Geographic and Canadian Geographic Travel magazines, with a brief explanation of why I think they’re particularly noteworthy. Like any good map, I think each has its own story to tell. Click each map for a closer look.
1. “Home range: The tracking of bear F148 during one week in July 2014,” Canadian Geographic April 2015
This accompanied a feature story by Leslie Anthony on what scientists in Alberta’s Banff National Park have learned by satellite tracking grizzly bears. The map was based on satellite tracking data from the grizzly known as F148, the focus of the story. It is both beautiful in this 3D-satelitte image rendering, and unbelievably impressive to see just how far — and how high — the bears travel in a short time, something nothing other than a map could so effectively convey.

2. “365 Days of Quakes: April 1, 2014 to March 31, 2015,” Canadian Geographic June 2015
Published with a feature on earthquakes in Canada by Anne Casselman, this map showed the location and magnitude of all the recorded earthquakes, both felt and not felt, in a one-year span. While it some respects it’s a simple design, the data is conveyed in such a clear and impactful way that it’s stunning to look at and explore. Plus, it’s amazing to see how many earthquakes actually occur in our nation in a year. Who knew?

3. “Go with the flow,” Canadian Geographic Travel Summer 2015
The centre point of a short piece highlighting the best waterway-related travel opportunities in Manitoba, this relatively simple map was particularly eye-catching. Land cover was stripped bare to focus on the province’s water resources, and they stand out in a stunning way that makes instantly clear just how much water covers Manitoba.

4.“County life,” Canadian Geographic Travel Fall 2015
This accompanied a short piece on autumn travel opportunities in Ontario’s Prince Edward County. Given the region’s unique shape — an island like peninsula that juts into Lake Ontario — the map’s shape worked very nicely in the layout. The land cover approach used here, which shows how agricultural the area is, also adds to the story this map shares by conveying another level of detail about the geography of this popular weekend getaway destination.

5.“Sir Christopher Ondaatje’s Voyage to the Galapagos Islands,” Canadian Geographic Travel Fall 2015
This map became the focal of the storytelling device to share details of Sir Christopher Ondaatje’s journey to the Galapagos to explore the region’s wildlife. The map is particularly beautiful, with an old-timey maritime chart feel — right down to the manila colouring — and very effectively conveys the spread of the area’s islands and their location (along the Equator), while also showing Ondaatje’s cruise route.

6.“Charting victory,” Canadian Geographic October 2015
Part of the Drawn to Victory project — in which Canadian Geographic has partnered with film production company Sound Venture to create a documentary and related educational resources about First World War cartography — this map was actually not created by Brackley. Rather, it’s a map created from the inset aerial photograph, a common process in the early days of large-scale cartography. It’s particularly noteworthy in that the inset image shows bomb craters and trenches on the Western Front in Europe during the First World War that, as is very evident, were clearly and definitively transferred to the map — part of a cartographic initiative that ultimately helped the Allies win the war.

7. “City central,” Canadian Geographic October 2015
These maps were the story. Each map of the downtown cores of one of six major Canadian cities (Toronto, Montreal, Vancouver, Calgary, Winnipeg and Halifax) was presented at the same scale, allowing the geography footprint and size of each to be easily compared. Each city’s key infrastructure — buildings, parks, major roadways, etc. — was also labeled, allowing readers to not only see how each city has been planned or developed, but also to compare the locations of key infrastructure from city to city. The best part of this story: that readers could explore these maps and find their own narratives.

Click here to see the full series of “City central” maps. (Map: Chris Brackley/Canadian Geographic)
Are you passionate about Canadian geography?
You can support Canadian Geographic in 3 ways:

History
A trip back in time to the memorial’s dedication

Mapping
Cartographic highlights from Canadian Geographic's 2017 issues and special publications

People & Culture
Award recipients honoured in the first virtual Annual General Meeting and Fellows Show.

Mapping
Cartographic highlights from Canadian Geographic’s 2021 issues