
Environment
Map: Every Canadian hurricane landfall since 1866
Experts predict a busier than normal hurricane season for 2016
- 466 words
- 2 minutes
This article is over 5 years old and may contain outdated information.
Science & Tech
Data on Dorian highlights how advancements in satellite imaging are changing our understanding of severe weather events
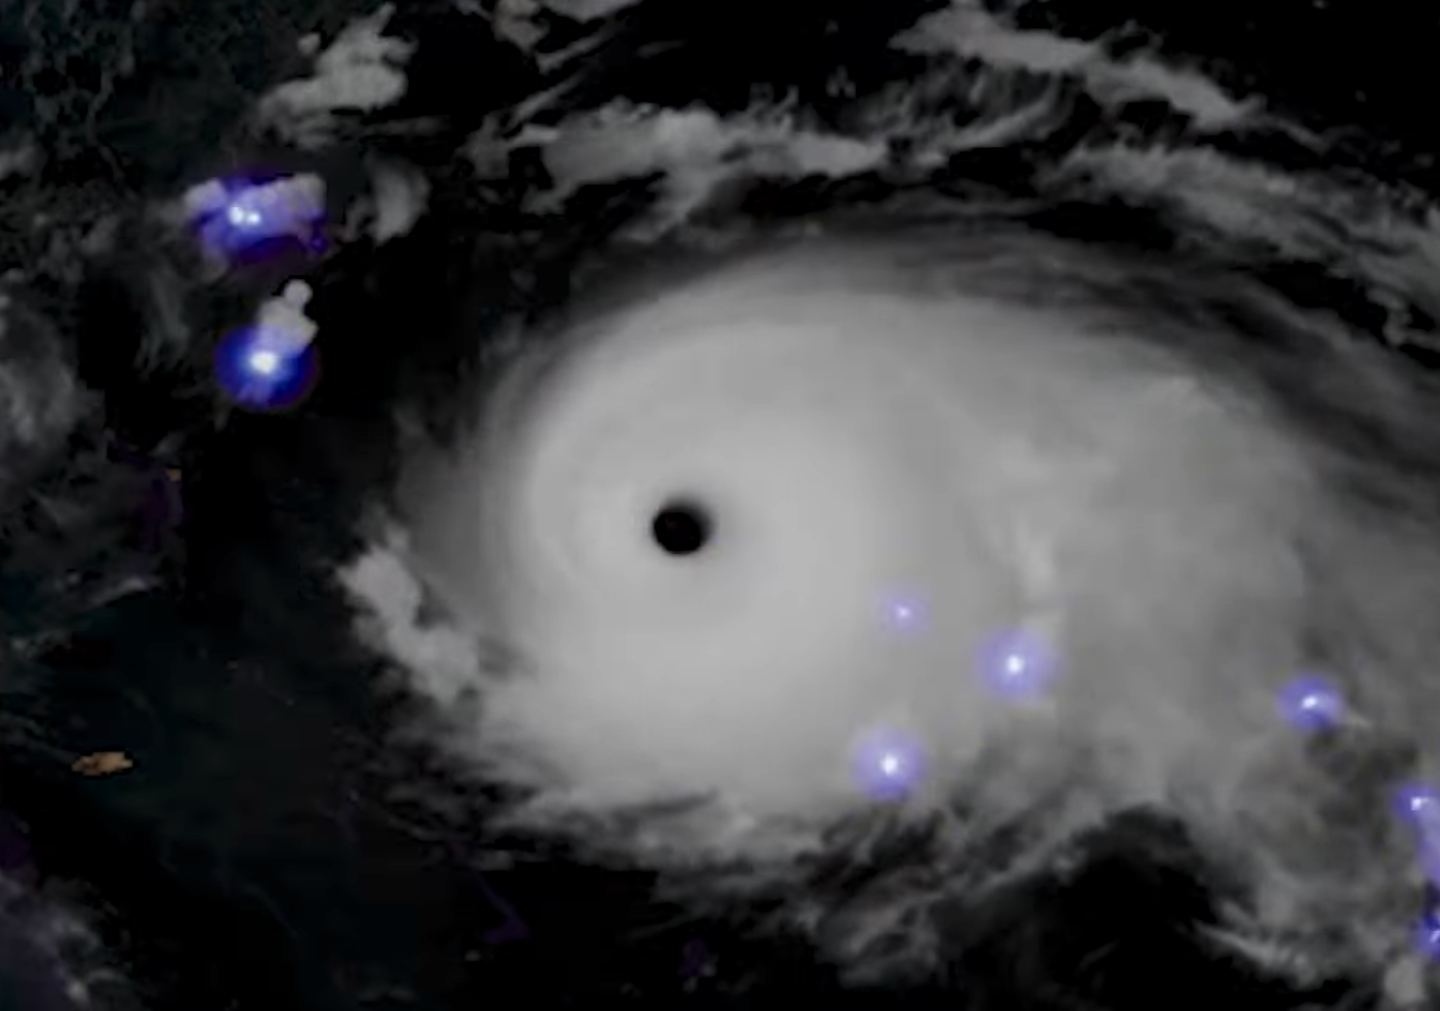
A new video of Hurricane Dorian from space offers a remarkable perspective on the life cycle of a destructive storm — and highlights how far satellite imaging has come in recent years.
Created by Dakota Smith, a meteorologist and self-described weather geek who currently works for the National Centre for Atmospheric Research in Boulder, Colo., the full nine-minute video uses 288 hours of data and images collected by GOES-16 to animate Dorian’s journey, from its birth as a tropical wave off the coast of Africa to its intensification into a monster Category 5 hurricane over the Bahamas to its post-tropical transition in the colder waters of the North Atlantic. Most remarkably, the video shows lightning activity within Dorian, something that wasn’t possible with earlier iterations of the GOES Earth observation program.
Since it was posted on Smith’s Twitter early Monday morning, the two-minute lightning clip has been viewed tens of thousands of times and generated dozens of questions and comments from curious weather-watchers. For Smith, who started using GOES-16 data to create looping gifs and videos during Hurricane Harvey in 2017, that engagement is the point.
“From a non-scientist’s point of view, [this imagery] helps put in perspective what our atmosphere is and what these storms actually are,” he says. “As a meteorologist, it helps me learn what questions people have about the weather. A lot of times they’re things I forget aren’t common knowledge.”
GOES, which stands for Geostationary Operational Environmental Satellite, is a joint program of NASA and the National Oceanic and Atmospheric Association that supports weather forecasting, severe storm tracking and research. Both the Meteorological Service of Canada and the National Weather Service in the United States use data from GOES for weather monitoring and forecasting. But the program is also a treasure trove of data for weather enthusiasts like Smith. The primary imaging instrument on GOES-16 can capture high-resolution images of cloud formation, convection, land temperature, ocean dynamics, fire, smoke, volcanic ash plumes and air quality. It has a first-of-its-kind geostationary lightning mapper, which captured the data Smith used for his video of Dorian. And it can be programmed to capture images of mesoscale weather events (such as lines of supercell thunderstorms) over a 1,000-square-kilometre area every 60 seconds.
“It’s really changed how we visualize severe weather,” says Smith. “With tornadic supercells in the plains, you can actually see the rotation in the thunderstorm.”
Smith, who also posts storm animations and explainer videos to his YouTube channel, Okay Let’s Science, hopes to use GOES-16 data to do more public education around the relationship between severe weather and climate change.
“One of the most difficult things, even for people in the weather science community, is decoupling weather and climate,” he says. “With major storms like Dorian, people tend to say it was caused by climate change, but storms happen. I think the better question to ask is, what is happening to that storm because of climate change?”
Environment
Experts predict a busier than normal hurricane season for 2016
Environment
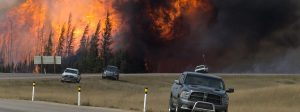
Fire detection, forecasting, management — and how decisions are made

Environment
Future ignitions may increase carbon emissions and accelerate the boreal forest’s northern expansion

Travel
The global explorer, adventurer, and TV host highlights his most dangerous experiences, regrets, what he has learned, and more