Along the Nunavik, Labrador, Newfoundland and eastern New Brunswick coasts, purple colour coding — for “species status: unknown” — dominates river systems. In the Bay of Fundy and Nova Scotia’s South Shore, the situation is known all too well: thick networks of red and black rivers highlight high-risk and extirpated populations.
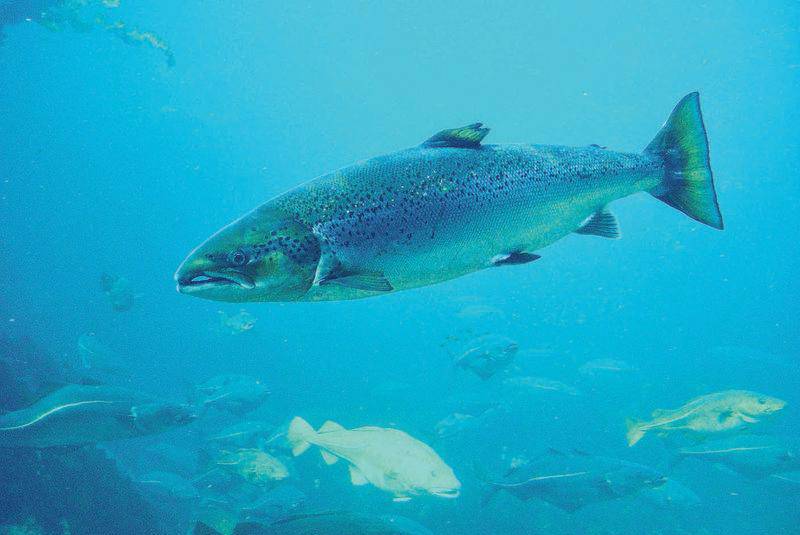
This map shows, for the first time, the scope of the threat status of Atlantic salmon spawning rivers in northeastern North America — a powerful tool for helping conservationists better understand the continent’s 17 Atlantic salmon populations, which travel each year from salt water to their natal rivers to spawn.
“Atlantic salmon are an indicator species,” says Neville Crabbe, a spokesperson for the Atlantic Salmon Federation, the New Brunswick headquartered organization leading the creation of this map. “Their presence often indicates that we’re doing something right, and they are often one of the first species affected when we’re doing something wrong.”
The international North Atlantic Salmon Conservation Organization and Fisheries and Oceans Canada brought together a range of previously collected information on the fish’s status to create the dataset. The ASF then tasked Ontario-based
cartographer Chris Brackley, of As the Crow Flies cARTography, with giving that population data shape by attaching it to GIS river datasets, colour-coding 1,100 wild Atlantic salmon rivers by conservation status to create the first comprehensive visualization of everything we know about the species. In its coming digital format, the map will provide conservationists, anglers and scientists with a snapshot of the stability of each river: population patterns, places where salmon are at risk of
collapse and areas that still lack much-needed data.
