Mapping
What are maps really saying about COVID-19 in Canada?
Canadian Geographic’s cartographer explores how media, scientists and citizens are charting the coronavirus pandemic
- 1180 words
- 5 minutes
Mapping
Canadian Geographic cartographer Chris Brackley continues his exploration of charting the coronavirus pandemic
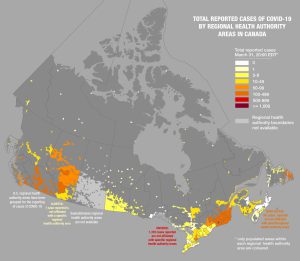
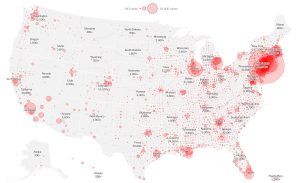
Last week, I explored some different approaches to mapping COVID-19 in Canada, all with an aim to show the data in its correct geography, connecting the numbers of cases to the places where those cases exist. Colouring the health authority areas with the number of cases was a geographic improvement over proportional circles without any bounded areas (more precise), but it did introduce some graphic misrepresentations. Cities had a very minimal visual weight (because of their relatively small geographic size), despite, in many cases, containing the majority of the population. Conversely, huge northern areas with tiny populations were visually dominant, despite representing very few people. And masking off areas where no one actually lives in these huge northern areas, created unintentional misunderstandings where a single case of COVID-19 caused all tiny pockets of population to be coloured, which did not make intuitive sense.
This time I’m going to introduce population numbers into the map to attempt a better representation of the relative rate of infection.
To do this, I first needed the population of each regional health authority. The most recent population data from Statistics Canada is from 2016, by census subdivision. Census subdivisions parcel the country into 5,162 pieces (white lines on the map below), and in almost all cases, these boundaries correspond to the regional health authorities (yellow lines on the map below).
Knowing how many people are within each health authority — calculated simply by counting the census subdivision population in each health authority — allows us to look at the per capita numbers of cases, as opposed to the absolute number of cases. Then, it’s possible to compare relative infection rates across health authorities in a meaningful way, giving us the ability to say, for example, that one in 1,000 or one in 10,000 people in a given area have contracted the virus.
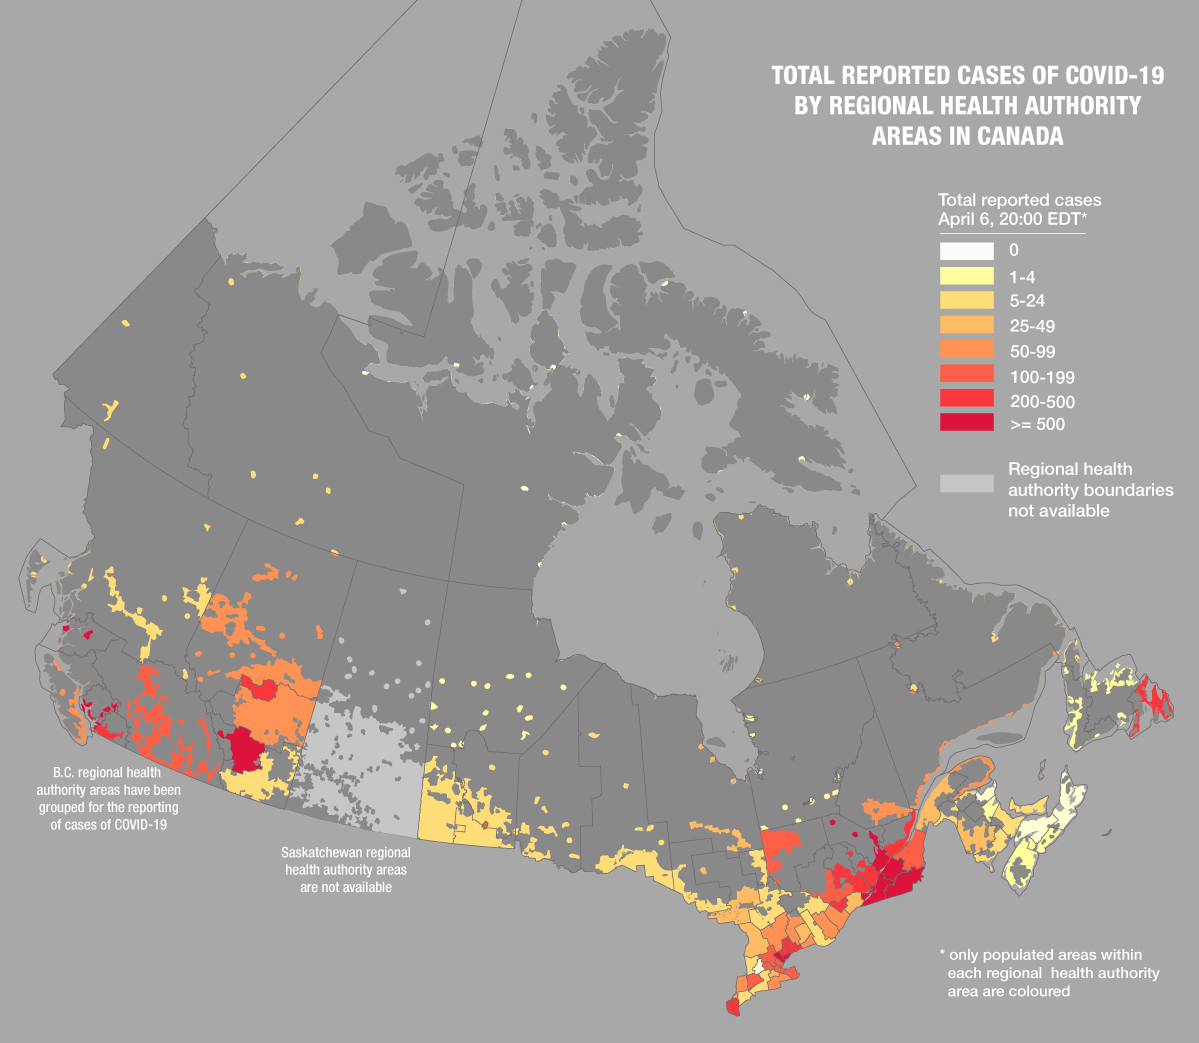
The total number of cases of COVID-19 in Canada for April 6, 2020, make densely populated areas seem relatively worse than they are, as is evident in the map below, where almost all urban and densely populated areas, including Vancouver, Calgary, Montreal and St. John’s, all end up near the top of the intensity scale.
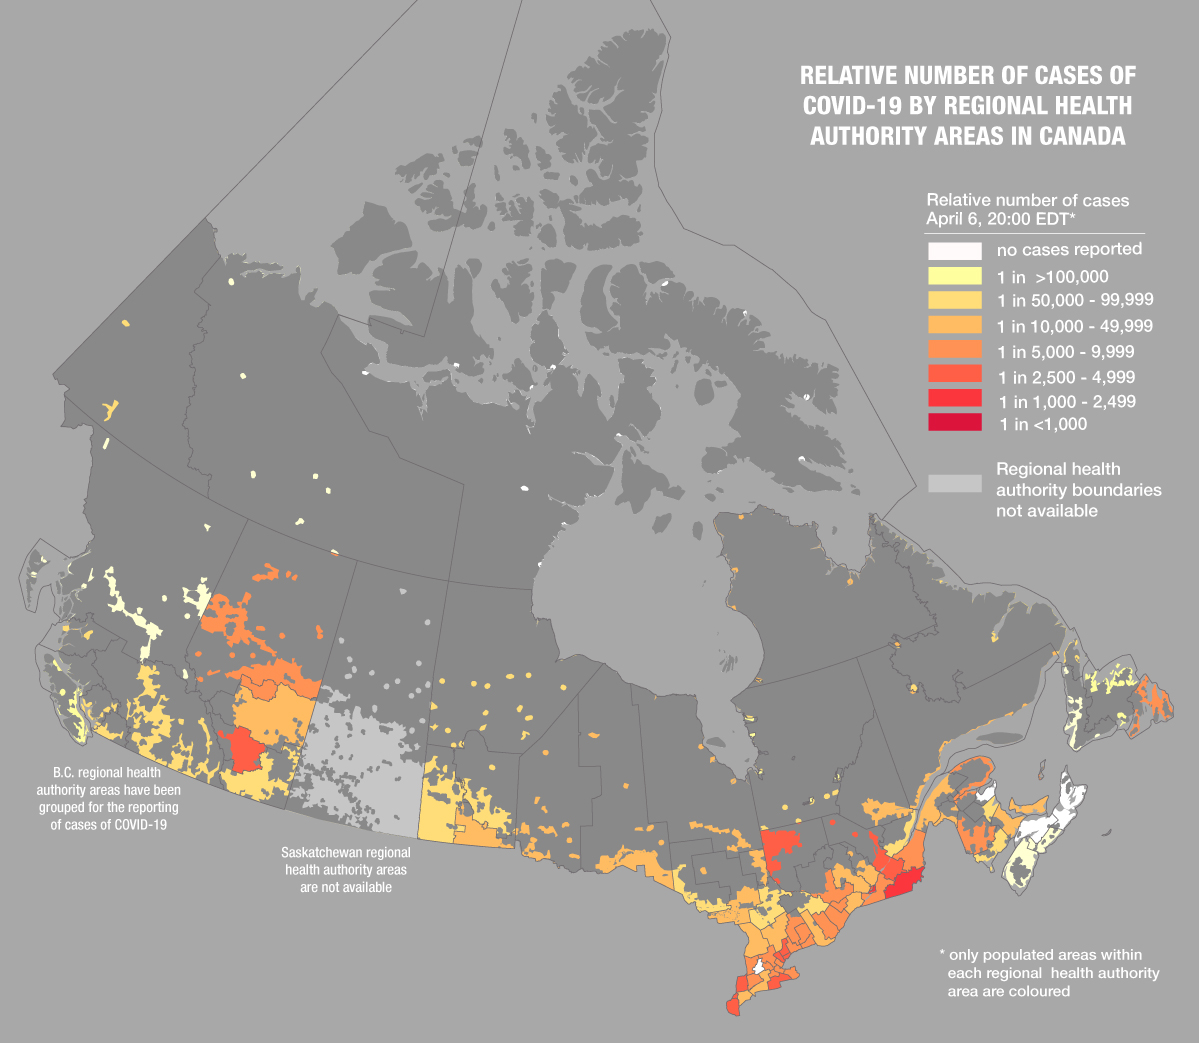
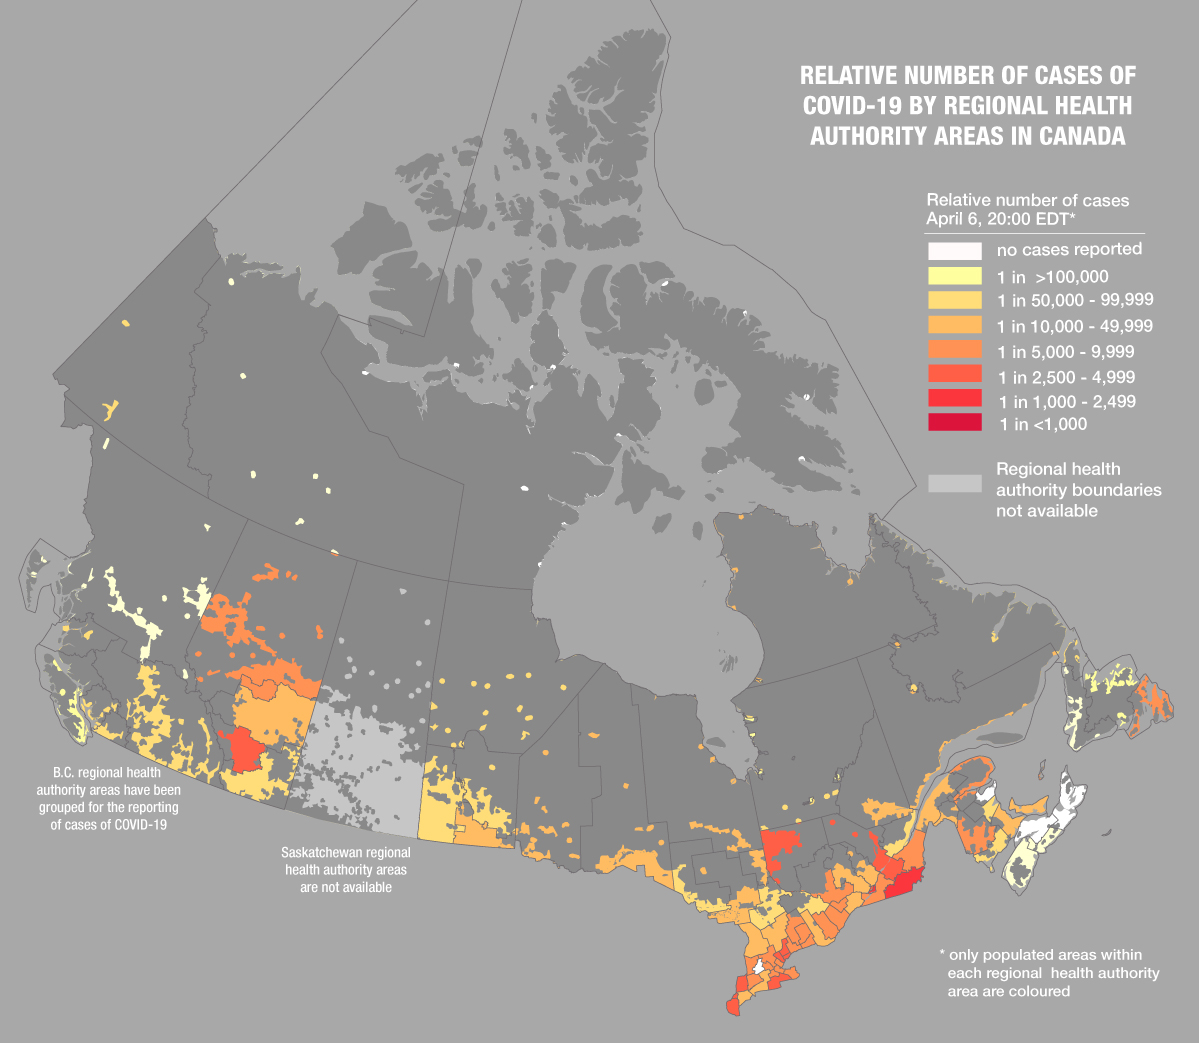
When we map relative numbers, however, we remove this bias which shows cities as universally the most severe because more people reside there. In the map below, the West Coast (which has had recent success in “flattening the curve”) rates much lower because we have used the relative infection rate. Simply put, we are now comparing per capita infection rates, and any map that normalizes data like this is far better suited to glean meaningful comparisons between different areas.
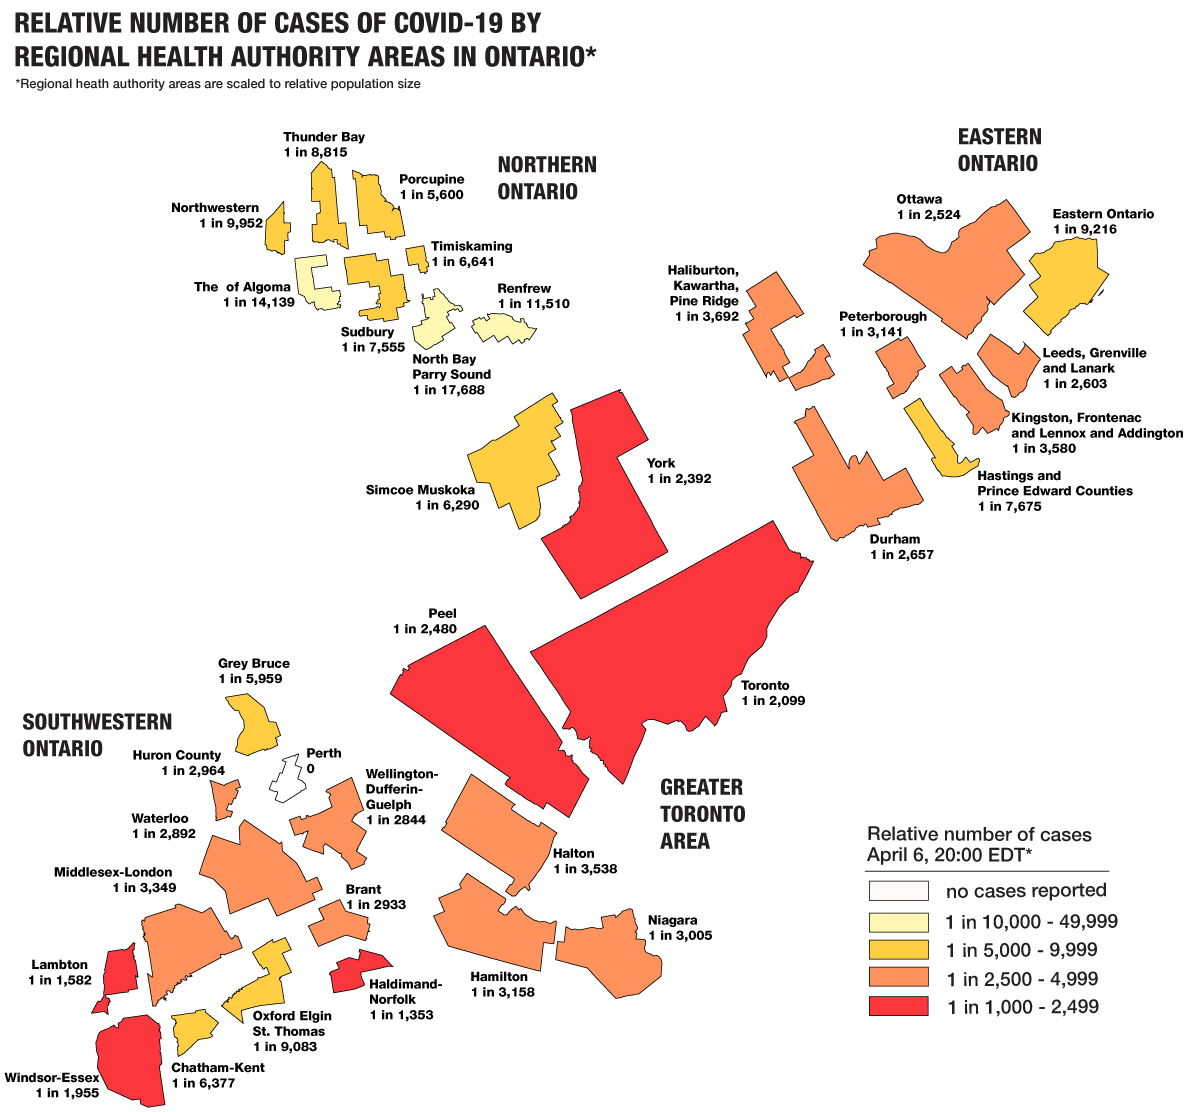
So, we have connected population to the scale of infection, but we have not necessarily accurately portrayed the population of a specific area relative to its geographic size. Toronto, for instance, is still the smallest area on the map, but has the largest population. To address this, we can use a “cartogram,” which, as the name suggests, is somewhere between a map and a diagram. The technique involves scaling geographic units (in this case regional health authorities) to sizes that are relative to a normalizing statistic. For mapping population-based data, scaling geographic units to their population is a great way to give more visual weight to dense cities, and less visual weight to thinly populated rural areas.
To make this cartogram, I first scaled each health authority in Ontario to be the same size, then each was scaled up or down based on the number of people in it. The result is still a map, in that each area has a correct shape, and relative position, but the scale of each area is based on population, not actual geographic size. In this way, it is more like a comparative diagram. And though this graphic is only vaguely recognizable as Ontario, it gives a much more correct sense of both the relative numbers of cases per capita (colour), and the absolute numbers of people in each area (size of each health authority).
Once again, it becomes evident that a range of cartographic tools can help tell the story of the COVID-19 pandemic in Canada in many different ways.
Are you passionate about Canadian geography?
You can support Canadian Geographic in 3 ways:
Mapping
Canadian Geographic’s cartographer explores how media, scientists and citizens are charting the coronavirus pandemic
Mapping
Canadian Geographic cartographer Chris Brackley continues his exploration of how the world is charting the COVID-19 pandemic, this time looking at how artistic choices inform our reactions to different maps
People & Culture
WHO says it’s “time to do everything you would do in preparing for a pandemic”
History
The little-known story of the 1918 Spanish Flu and how we're preparing for the next great pandemic