Places
Seven things you might not know about Prince Edward Island
Upgrade your Canadian trivia skills with some lesser-known facts about Canada’s seventh province
- 852 words
- 4 minutes
This article is over 5 years old and may contain outdated information.
Mapping
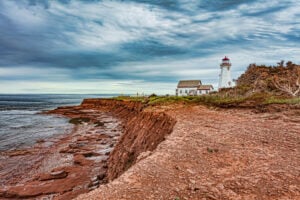
How a digital visualisation is showing islanders the future toll of climate change on their home

It started as a creative third-year university project — a way of showing how rising seas are shaping the shores around Charlottetown. But here, University of Prince Edward Island Climate Lab director Adam Fenech tells how CLIVE (aka the CoastaL Impacts Visualization Environment: a realistic, interactive visualization of coastal erosion) is now being used to help the P.E.I. government, municipalities in other provinces and states and community planners prepare for escalating ocean levels, vanishing beaches and cliffs and inevitable damage to infrastructure such as homes, sewage treatment facilities and roads.
While I was teaching at the University of Toronto during a summer institute, Alex Chen, an undergrad at B.C.’s Simon Fraser University, asked me for access to some of our hi-res digital elevation models of P.E.I. Using a gaming software called Unity, he put together what was essentially a video game that allowed you to fly over Charlottetown while raising and lowering the sea levels. Not long after, I was giving a presentation at the City of Charlottetown’s 2013 Earth Day proceedings. I gave my usual spiel, and then said, “I have this little game I want to show you. This is Charlottetown, and this is what will happen — future sea-level rise.” There were audible gasps in the audience. That’s when I thought, “Wow, I think we’re really on to something here,” so I asked Chen if we could do the same thing for the whole island.
We started working with Nick Hedley from Simon Fraser University’s faculty of environment, whose specialty is visualizing 3D geospatial data, and sat down with a bunch of other researchers I’d been working with to study rates of coastal erosion, looking at the vulnerability of existing infrastructure.
I think it’s the idea of creeping water. A lot of times we talk about environmental change in these very long time frames — especially with climate change. It’s this insidious change that you don’t really notice. Human beings only have the psychological capacity to understand change at certain rates — like when you move away from a city and you come back six months later and notice huge differences. That’s the sort of thing we’re talking about. CLIVE allows us to show environmental change — which could take decades or a century — in seconds. Visibly creeping water causes anxiety, I think. When we raise sea levels, you can feel your heart rate increasing. There must be some kind of innate response built into humans for survival: “Hey! The water is rising around you. Run!”
In our study we looked at every single metre of the shoreline, and were able to quantify the amount of erosion that had occurred since 1968 and was still occurring. To try to understand what the future looked like, rather than thinking of modelling probable future rates, we decided to use those existing rates of erosion. Those are very conservative, and we did that on purpose. It helps when you’re explaining to the general public and to potential skeptics that we’re only using what we’ve already observed. And the rates were high enough already that we didn’t want to cause any widespread panic.
The real message is “stop building so darn close to the shoreline.” When things like wastewater treatment facilities get flooded, they end up contaminating bays. That can lead to, for example, the closure of a shellfish industry. Sometimes one event can lead to millions of dollars in damages. If you build close to the shore — which many engineers do because there you get a constant input of water — you will end up having to move your structure. That’s what’s already happened in North Rustico, with their wastewater treatment facility, but it cost a couple million bucks. And very often, a small place like P.E.I. doesn’t have that kind of money.
Everybody has access to our results, if they want. The P.E.I. institute of planners gave us a special award for raising the importance of issues related to development and this shoreline loss. Their discussions about infrastructure, however, weren’t so much about the homes that will be moved or destroyed; they were interested in the wells, which are close to homes, the septic tanks (in case of contamination) and the roads.
We’re building CLIVE for other communities, such as Colchester County, N.S., doing preliminary work looking at the city of Collingwood, Ont., with the University of Michigan. The most advanced discussion we’ve had is with the University of Southern California — working with the city of Los Angeles. Erosion is not a huge issue there, but they lose a lot of sand on their city beaches … replenishing them for tourism and local recreation. The cost of that is huge, and the local planners wanted to have CLIVE for the sake of their discussions about the fact that sea level rise is going to mean significantly more beach replenishment than they’re doing now. Are they prepared to pay those escalating costs?
We originally used lidar (light detection and ranging) data collected by the provincial government by airplane in 2008, but we call that vintage already! And while we used to look at things on a regional basis, studies are becoming more and more micro. So we’ve recently purchased a fleet of drones, and the imagery we get from them has a resolution of two centimetres — compared to the old lidar data, which was 1.5 metres. We can see footprints on the sand when we build our mini CLIVEs out of this imagery.

This story is from the June 2016 Issue
Places
Upgrade your Canadian trivia skills with some lesser-known facts about Canada’s seventh province
Exploration
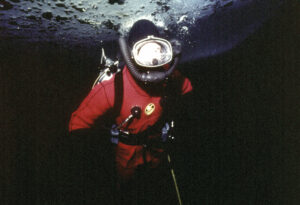
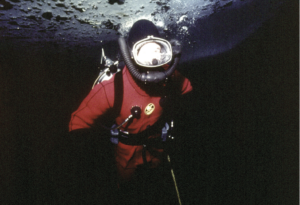
Remembering a 1975 journey under the ice of the Northwest Passage with King Charles III
Exploration
Souvenir d’un périple sous la glace lors de la venue du roi Charles III dans le passage du Nord-Ouest en 1975

Environment
On the last weekend in May, a group of around 20 Prince Edward Islanders gathered at St. Peters Harbour on the Gulf of St. Lawrence to shore up their province's defences against…