Exploration
The pull of Everest
A century after a Canadian was instrumental in charting the world's highest peak, a fellow Canadian reflects on the magnetism of Everest
- 4083 words
- 17 minutes
This article is over 5 years old and may contain outdated information.
Mapping

If you’ve ever returned to a city after a long period of time away and been amazed at the number of new condo buildings, housing developments, business parks, roads and shopping centres that have sprung up in your absence, you’ll likely find these new maps from Statistics Canada fascinating and telling.
The maps are part of an updated study on the changing landscape of Canadian metropolitan areas released by StatsCan on March 22nd.
The study analyzes changes in land cover and land use in and around Canadian cities from 1971 to 2011 and sounds the alarm on the disappearance of natural land covers as a result of downtown intensification and urban sprawl.
Although Canada’s built-up area* represented only 0.1 per cent of the country’s total area in 2011, urban expansion has increasingly resulted in the loss of prime farmland, simply because many Canadian cities were originally established on fertile agricultural land. The expansion and intensification of built-up areas also results in the loss of forests, wetlands and recreational green spaces – and once made, these changes are usually permanent, the study notes.
The loss of these natural features impacts everything from food production, wildlife habitat and flood protection to human behaviour. StatsCan has made the maps available to researchers and city land-use planners to further our understanding of the impacts of urbanization.
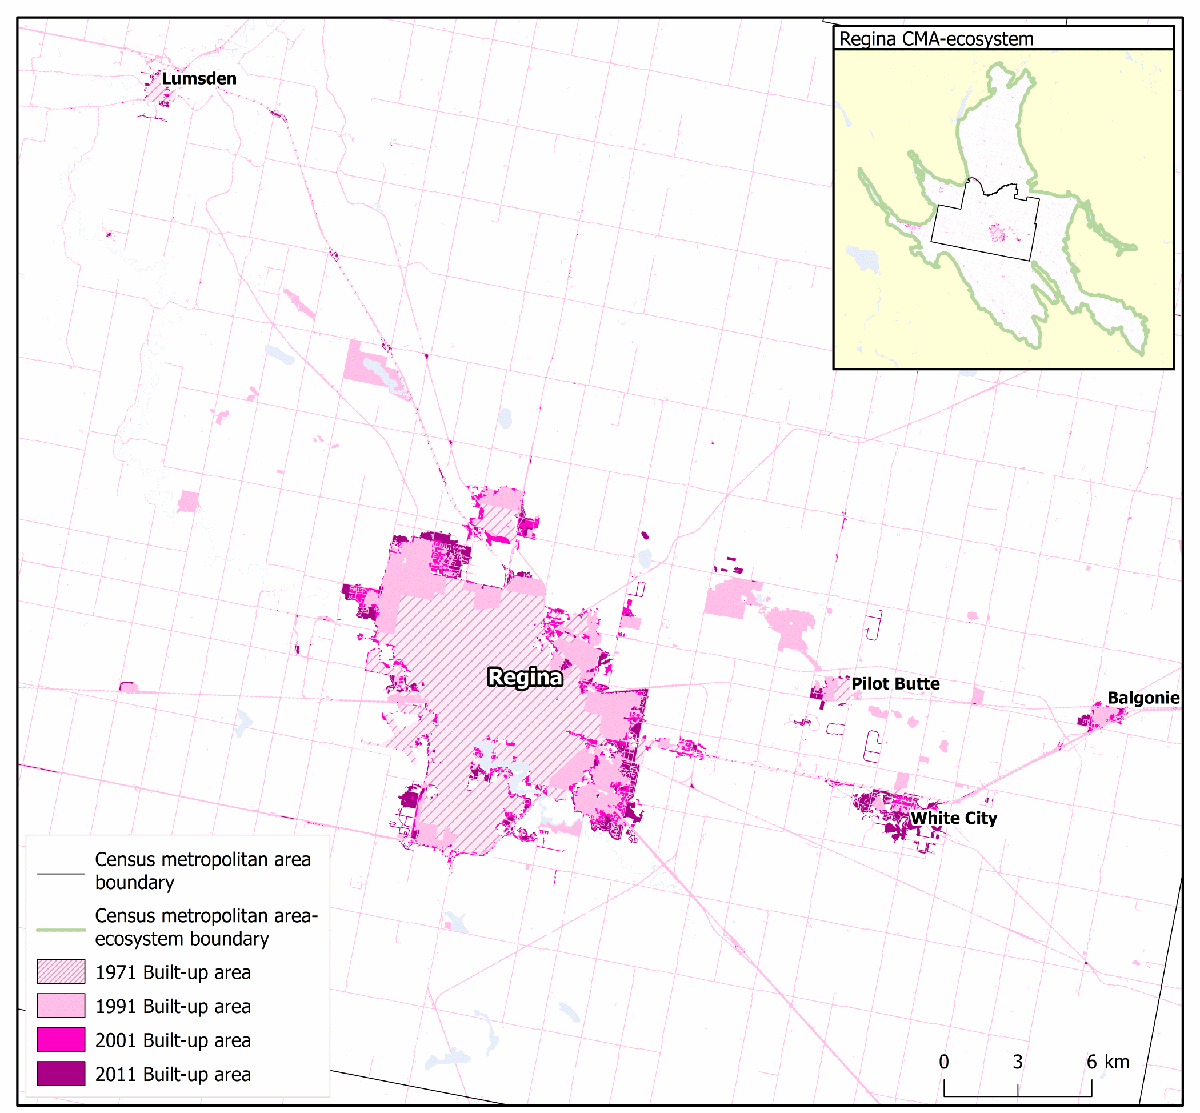
We’ve compiled a few of the maps and highlighted notable changes below.
*Built-up area includes buildings, roads, parking lots, parks and gardens. It is where most Canadians live and work, including residential, commercial, institutional and industrial areas. Overall, the total built-up area across the country covered 14,546 square kilometres in 2011, compared to 5,651 square kilometres in 1971.
Toronto

Montreal

Edmonton

Regina

Vancouver

Are you passionate about Canadian geography?
You can support Canadian Geographic in 3 ways:

Exploration
A century after a Canadian was instrumental in charting the world's highest peak, a fellow Canadian reflects on the magnetism of Everest

People & Culture
A celebration of the Canadian Coast Guard’s renowned search-and-rescue capabilities — and more — as the special operating agency turns 60

History
A trip back in time to the memorial’s dedication

History
Michael Adams, president of the Environics group of companies and the Environics Institute, and a regular contributor of published commentary on Canadian values and social trends, says most Canadians view multiculturalism as an important symbol of what we aspire to as a society