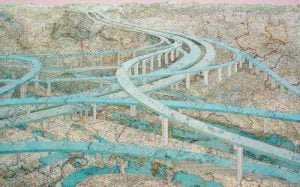
(Map: ATCFC; Land cover data provided by Commission for Environmental Cooperation)
This map shows North America parsed into distinct landcover classes. Different classes are coloured to be distinct from one another, as well as evocative of the places they represent. Shades of green for different forest types (bluer green for evergreens and wetlands, yellower greens for deciduous forests), yellows for agricultural lands (evoking dried grasses), orange/browns for desert landscapes, etc.
While these colours will not be completely true of every place they’re meant to represent, the most important aspect of classing land cover is to make clear (with use of the legend) the specific kind of environment one would find at any place on the map. Cities pop on this map, the agricultural lands are distinguished from surrounding forests.
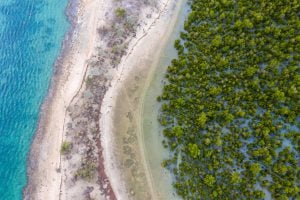
As for the ocean, which is often largely ignored on most maps, elevation (or in this case depth—also know as bathymetry) is actually the most intuitive way to understand the marine environment. Ocean depth is the best single indicator of the kind of environment one might find in a given part of the ocean, and so seems a good analogue for land cover.
As I said to begin this post — maps are by definition relational, and a truly deep map is one that shows a river passing not through an infinite sea of yellow background, or an undefined series of textures and colours, but instead through clearly defined mosaic of cities, forests, deserts, etc. And while I continue to see far more maps with hypsometric tinting or satellite imagery as their contexts, my hope is to see the rise of landcover as the new background of choice for mapmakers.
Chris Brackley is Canadian Geographic’s resident cartographer. A version of this article originally appeared on his website As The Crow Flies Cartography. It has been republished here with his permission.